Blog Post
Integrating unstructured data sources in a matter of hours - not months

Unstructured data makes up over 95% of all recorded human knowledge.
It was a lightbulb moment during lockdown; a few days after the team completed a piece of work, it suddenly hit me. Online posts from Twitter, Facebook, Instagram, blogs, forums, news, reviews and videos were fused with call centre audio files and survey verbatims in just 3 days, done for the first time and done right. Albeit from very different sources, involving both solicited and unsolicited opinion, this data had something in common - it was all unstructured data.
For the uninitiated market researcher or data cruncher unstructured data exists in different formats such as:
- - Text
- - Image
- - Audio
- - Video
Structured data on the other hand is numbers in tables such as:
- - ad expenditure data by company/brand/variant
- - market shares from retail audit reports
- - brand health reports from a survey tracker
- - accounting data (sales, profit etc.)
When I compare the amount of effort that is required to integrate structured data, with what we experienced integrating text and audio (unstructured data) during the “light bulb event” the contrast could not be more surprising!
If you are dealing with numbers in tables, you’re looking at column headings, product names, units and rigid time periods, so integrating various sources means that everything should be harmonised, for example:
- - you may have market shares by brand variant from a NielsenIQ or IRI retail measurement report, but you only have ad expenditure data at the total brand level.
- - there could be different descriptions for the exact same product e.g. coke 6 pack 330 ml vs 330 ml coke cans
- - a survey could be carried out monthly, while the retail measurement report is available every two months, and social intelligence is reported daily.
Harmonising structured data to import it into one platform and then further manipulate it to integrate the various sources in order for meaningful analytics to be possible takes weeks, sometimes even months, compared to the 3 days to import, integrate, annotate, and explore unstructured data from various sources.
The Data Fusion Process
With unstructured data the integration process is simple; all data in text format can be annotated for relevance, brand, sentiment and topics in an automated way using machine learning models or taxonomies. Data in other formats (such as image or audio) can be converted into text in order for the same process to follow. This makes it possible to annotate call centre conversations or images from social media, just as easily as text in online posts and responses to open ended questions from surveys.

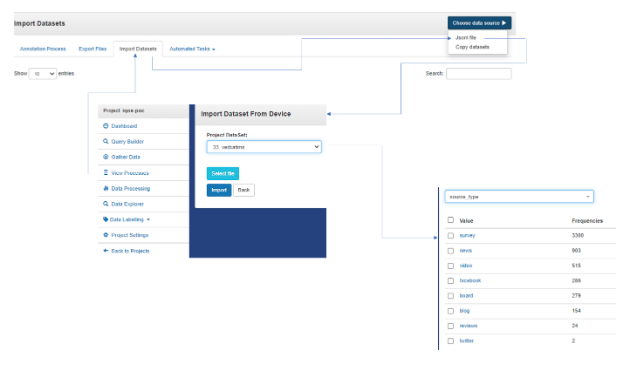
Fig. 1 Ingesting survey verbatims on listening247
The difference that makes all the difference (pun intended) when it comes to integrating structured vs unstructured data is that with the former the intelligence is already an added layer before the data fusion takes place, whilst with the latter the text is ingested and integrated before consistent intelligence is added to the dataset as a whole e.g. brands, sentiment/emotions and topics. Once the data is integrated it is already homogeneous (since it is all text) so it is straightforward to annotate it using custom or generic machine learning models and taxonomies - without having to worry about harmonisation.

Fig 2. Annotated online posts with brand topics and sentiment on listening247 Data Explorer
There are some obstacles to integrating and annotating unstructured data other than text such as audio that needs to be transcribed and images that need to be captioned with text; only when that happens can the accurate annotation of all the integrated data sources take place. There are even more obstacles if the data to be fused involves multiple languages.

Fig. 3. Image caption example, image-to-text
Thankfully, technology is available to enable voice-to-text and image-to-text transformation, as well as accurate annotations. Without accurately adding layers of intelligence, big data and especially text is not only useless, but with the wrong labels also harmful.
Conclusion
A data analyst cannot be expected to read millions of online posts, but what they can do is use a smart filtering tool to drill down and explore the annotated documents (e.g. social media posts or call center threads) and discover the “gold nuggets”, the elusive actionable insights.
The future of unique and actionable insights lies in data fusion of unstructured + structured data. Some of this data will belong to the companies e.g. sales data, and some they will need to procure e.g. 3rd party online posts or survey results.
Integrating unstructured data is more effortless and straightforward than you might think. You only need a good unstructured data analytics tool.