Blog Post
Is alternative data a fad?

A few days after I registered listening247 on alternativedata.org (a spur of the moment kind of thing), companies I had never even heard of before started reaching out to explore cooperation. One of them was Bloomberg. Obviously they were an exception - I did happen to know them.
The unknown (to me) companies were mainly conference organisers fishing for alternative data providers, to bring them together with investment funds... So we bit.
Our first question as you may imagine, was: what is alternative data? They said that there are many categories such as sentiment from social and news, app usage, surveys, satellite imagery, geo-location etc. and their main use is to give investors an edge in predicting stock prices.
Funnily enough, they all used the same example to bring their point home: satellite images of retailer parking lots, that depending on how full they are, can predict the retailer’s sales and share against competitors. I have to admit, even though it’s a bit out there it does make sense.
Traditionally investment funds and other traders use fundamentals to make their investment decisions. Even though alternative data and the ability to analyse it (using machine learning) have been around for over a decade, in the last 12 months - i have the impression - chatter about it is going through the roof.
I am thinking: “looks like we caught this wave quite early”.
One of my favourite business success analogies is 'the surfer'; for the act of surfing, 3 things are required: a surfer, a surfboard and a wave. The surfer is the CEO of a company, the surfboard the company itself, and both are waiting for the mother of all waves to lift and accelerate them. Without the wave, even the best CEO with the best functioning company will not make it far.
Needless to say, we jumped in with both feet.
Next order of business was to figure out for ourselves to what extent our “alternative data” correlates with stock prices. It so happened that when all this interest became apparent we were considering to focus on social intelligence for the banking sector; so when a well known business school asked us if we wanted to investigate the correlation of Bank Governance stories in online news and social media to their business performance we knew exactly what needed to be done.
If you are a regular reader of our articles you will already know the scope of the social intelligence project we carried out:
- Keywords for harvesting: 11 major brands including HSBC, Barclays, RBS, Deutsche Bank etc.
- Language: English
- Geography: Global
- Time Period: 1st May 2018 - 30th April 2019
- Data sources: Twitter, blogs, boards / forums, news, reviews, videos
- Machine learning annotations: sentiment, topics, brands, and "noise" (irrelevant posts picked up due to homonyms)
The data scientists and researchers of listening247, after having cleaned the data from “noise”, annotated each post with topics and sentiment using custom machine learning models. The sentiment, semantic and brand accuracy were all above 80%.
They then regressed the daily stock price of the banks against various time series derived from the annotated posts that were harvested.
The results were astounding!
For each of the 4 examples below I will describe the social intelligence metrics that were correlated with daily bank valuation. As with all R&D projects there was a lot of trial and error going on. What was impressive…….hmmm, I will not give this away yet.
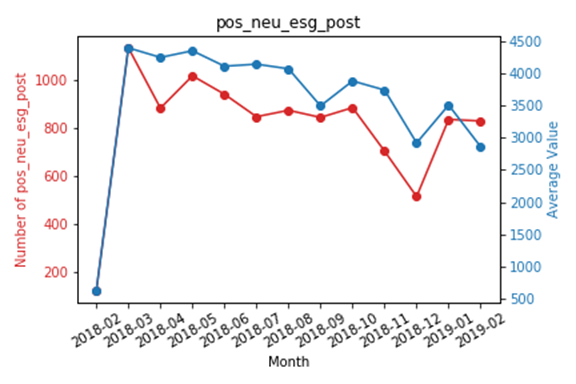
- 1. For Societe Generale when we correlated ESG (Environmental, Social, Governance) posts only from News - which means editorial as opposed to consumer posts - regardless of sentiment, the correlation factor of monthly total posts and monthly valuation was R² = 0.79. With the exception of the red spike in the graph below, not bad I would say.

Fig 1.
- 2. For the Royal Bank of Scotland (RBS) the correlation factor was even higher when we correlated the posts from News about ESG with positive and neutral sentiment: we got R² = 0.87. In this case we used the 30 day rolling average for both variables. Also visually it looks really impressive - in the graph below.

Fig 2.
- 3. Can it get any better? You bet!! Barclays - using almost the same parameters as for the RBS case but from all sources instead of just News, returned a correlation factor of R² = 0.92. By the time I see the Barclays result I am thinking “unbelievable”.
- Well, not really. Not only is there correlation between the two, but we also know which way causation goes. Traders are indeed influenced by what is circulating in the news and on social media when they trade.

Fig 3.
- 4. Example number 4 is equally impressive even though the correlation factor is lower. For Deutsche Bank, we correlated negative posts about ESG against their stock price using a 30 day rolling average R² = -0.40. It turns out it makes perfect sense, when the red line (number of negative posts) goes up the Deutsche Bank stock price goes down and when the red line goes down the blue line goes up.

Fig 4.
Amazing! Our alternative data turns out to be quite useful primarily to discretionary, and private equity and with a few adjustments to quantitative funds. It feels like the sky is the limit. We probably need to create a new business unit to deal exclusively with the 15 social intelligence metrics that we discovered to date.
Please do reach out and share your views or questions @listening247, mmichael@listening247.com if you find this interesting.